
To discover which locations in the UK have the best job opportunities, Ciphr ranked 100 of the most populous towns and cities in the country based on factors like average salary, wage growth, employment rate growth, unemployment rate, job listings, and the number of businesses.
House prices and rental costs were also included in the analysis to reflect the city’s affordability and cost of living, as were life satisfaction and happiness scores (from the Office for National Statistics) to show the population’s general level of wellbeing.
Points were allocated based on where each town or city ranked between the highest and lowest values for each factor/metric (for example, the place with the highest salary scored 100, while the location with the lowest salary scored 1). The results were then weighted, and the town or city with the highest overall score out of 100 was ranked first on the index.
Main findings for 2024:
- Winchester, Warrington, St Albans, Chelmsford, and Sevenoaks are the top five towns and cities for job opportunities, with good average salaries, high business density, and lower-than-average unemployment rates.
- Newcastle-under-Lyme is the best UK town for employment rate growth, up 23.9% in 2023. Its employment rate is one of the highest in the UK at 89.6%
- Sevenoaks has the highest wage growth of any town in the study, with the latest figures showing an above-inflation 18.2% increase in full-time annual earnings to £41,239
- St Albans has the highest average salary for full-time employees at £47,641 (36% above the national average of £34,963)
- Winchester has the highest business density of any UK city at 179.1, which means that there are over 179 businesses (with over 10 employees) for every 10,000 local workers. Stratford-upon-Avon has the next highest business density at 107.3 (the UK average is 70.2)
- Solihull saw the biggest (11.9%) increase in number of businesses (with over 10 employees)between 2022 and 2023. Canterbury and Telford also saw their business numbers rise by 9%
- Sevenoaks, St Albans, Maidstone, Lancaster, and Havant are among the happiest places to live and work, with residents reporting higher levels of life satisfaction and personal happiness than any other towns and cities in the study
- Blackburn, Stockton-on-Tees, Preston, Wigan, and Hull are the UK towns and cities with the most affordable housing (to rent or buy on an average full-time salary)
Winchester 
1st
Working age population
79,558Salary
£40,600vs UK average salary
+£5,637Salary growth
14.8%Unemployment rate
2.7%Employment rate
81.1%Employment rate growth
8.6%Business density
179.1Business growth
6.3%Property price / salary multiple
£665,891 / 16.4Monthly rent / % of salary
£1,200 / 35%Life satisfaction + happiness
14.92Warrington

2nd
Working age population
131,859Salary
£34,400vs UK average salary
-£563Salary growth
5.8%Unemployment rate
2.8%Employment rate
80.2%Employment rate growth
3.2%Business density
75.1Business growth
4.8%Property price / salary multiple
£262,694 / 7.6Monthly rent / % of salary
£695 / 24%Life satisfaction + happiness
14.77St Albans

3rd
Working age population
90,464Salary
£47,641vs UK average salary
+£12,678Salary growth
1.4%Unemployment rate
3%Employment rate
85%Employment rate growth
0.2%Business density
84.0Business growth
1.3%Property price / salary multiple
£622,921 / 13.1Monthly rent / % of salary
£1,384 / 35%Life satisfaction + happiness
15.57Chelmsford

4th
Working age population
113,284Salary
£36,252vs UK average salary
+£1,289Salary growth
1.4%Unemployment rate
2.9%Employment rate
83.9%Employment rate growth
9.7%Business density
75.5Business growth
3%Property price / salary multiple
£395,678 / 10.9Monthly rent / % of salary
£1,100 / 36%Life satisfaction + happiness
15.34Sevenoaks
5th
Working age population
70,630Salary
£41,239vs UK average salary
+£6,276Salary growth
18.2%Unemployment rate
3%Employment rate
74.6%Employment rate growth
1.3%Business density
90.6Business growth
1.6%Property price / salary multiple
£740,031 / 17.9Monthly rent / % of salary
£1,395 / 41%Life satisfaction + happiness
15.62Preston

6th
Working age population
99,163Salary
£33,188vs UK average salary
-£1,775Salary growth
14.8%Unemployment rate
4%Employment rate
80.4%Employment rate growth
16.5%Business density
67.6Business growth
-2.2%Property price / salary multiple
£178,247 / 5.4Monthly rent / % of salary
£575 / 21%Life satisfaction + happiness
15.17Cheltenham

7th
Working age population
75,182Salary
£35,973vs UK average salary
+£1,010Salary growth
-5.5%Unemployment rate
2.5%Employment rate
82.9%Employment rate growth
-3%Business density
81.8Business growth
1.7%Property price / salary multiple
£407,347 / 11.3Monthly rent / % of salary
£900 / 30%Life satisfaction + happiness
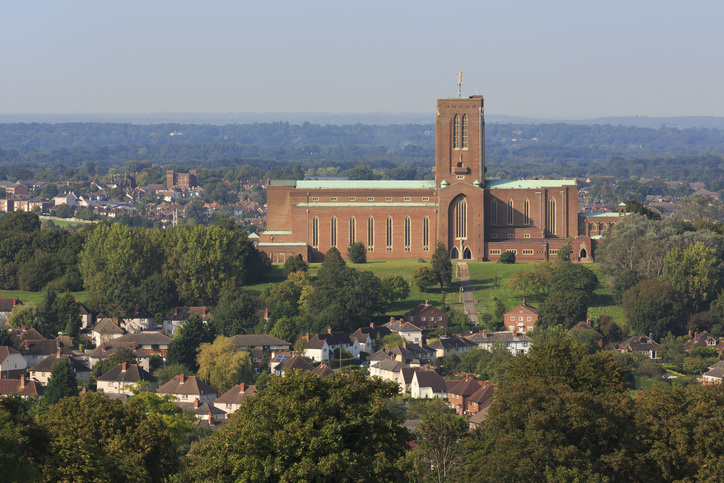
15.14Guildford

8th
Working age population
95,152Salary
£40,142vs UK average salary
+£5,179Salary growth
-6.1%Unemployment rate
2.5%Employment rate
81.5%Employment rate growth
0.3%Business density
87.2Business growth
3.1%Property price / salary multiple
£840,608 / 20.9Monthly rent / % of salary
£1,317 / 39%Life satisfaction + happiness
14.99Aberdeen

9th
Working age population
150,298Salary
£35,153vs UK average salary
+£190Salary growth
9.3%Unemployment rate
4.3%Employment rate
74.7%Employment rate growth
4.9%Business density
77.2Business growth
2.2%Property price / salary multiple
£182,000 / 5.2Monthly rent / % of salary
£686 / 23%Life satisfaction + happiness
14.84Reading
10th
Working age population
120,222Salary
£36,861vs UK average salary
+£1,898Salary growth
11.4%Unemployment rate
3.5%Employment rate
86.1%Employment rate growth
9.5%Business density
68.2Business growth
1.2%Property price / salary multiple
£421,837 / 11.4Monthly rent / % of salary
£1,150 / 37%Life satisfaction + happiness
14.85Bedford

#11
Working age population
117,693Salary
£40,647vs UK average salary
+£5,684Salary growth
2.6%Unemployment rate
4.2%Employment rate
81%Employment rate growth
6.9%Business density
61.6Business growth
3.6%Property price / salary multiple
£328,750 / 8.1Monthly rent / % of salary
£850 / 25%Life satisfaction + happiness
15.05Solihull

#12
Working age population
129,125Salary
£38,942vs UK average salary
+£3,979Salary growth
4.3%Unemployment rate
3.7%Employment rate
77.6%Employment rate growth
-0.4%Business density
70.9Business growth
11.6%Property price / salary multiple
£355,523 / 9.1Monthly rent / % of salary
£950 / 29%Life satisfaction + happiness
15.2Wokingham 
#13
Working age population
111,854Salary
£40,172vs UK average salary
+£5,209Salary growth
11.4%Unemployment rate
2.6%Employment rate
78.6%Employment rate growth
-5.3%Business density
74.2Business growth
3.1%Property price / salary multiple
£530,908 / 13.2Monthly rent / % of salary
£1,260 / 38%Life satisfaction + happiness
14.99Stafford 
#14
Working age population
83,065Salary
£37,103vs UK average salary
+£2,140Salary growth
8.7%Unemployment rate
3.3%Employment rate
76.5%Employment rate growth
-0.9%Business density
75.8Business growth
7.7%Property price / salary multiple
£246,614 / 6.6Monthly rent / % of salary
£675 / 22%Life satisfaction + happiness
14.28Stratford-upon-Avon 
#15
Working age population
80,608Salary
£36,763vs UK average salary
+£1,800Salary growth
-0.5%Unemployment rate
3.1%Employment rate
85.3%Employment rate growth
5.3%Business density
107.3Business growth
-0.6%Property price / salary multiple
£430,920 / 11.7Monthly rent / % of salary
£893 / 29%Life satisfaction + happiness
15.3Key:
- Rank = overall weighted rank
- Working age population = People aged 16 to 64 years old
- Salary = where mentioned, salary always refers to the median average annual earnings for full-time employees (2023)
- vs UK salary = difference between the city’s average salary and the UK’s median average salary for full-time employees (£34,963)
- Salary growth (2023 vs 2022) = change in salary over the last 12 months
- Unemployment rate = for people aged 16 and older (Jan 2023-Dec 2023)
- Employment rate = for people aged 16 and older (Jan 2023-Dec 2023)
- Employment rate growth = change in employment rate between Jan 2022-Dec 2022 and Jan 2023-Dec 2023
- Business density = number of VAT and/or PAYE based enterprises (with over 10 employees) per 10,000 working age population (2023)
- Business growth = change in the number of VAT and/or PAYE based enterprises (with over 10 employees) between 2022 and 2023
- Property price = average median sold price for all property types (in the last year)
- Salary multiple = multiples of salary required to buy the average property
- Monthly rent = median average monthly rental price (2023)
- % of salary = proportion of salary spent on rent
- Life satisfaction + happiness = measurement of how satisfied people feel about their life overall and levels of personal happiness (Apr 2022-Mar 2023). Combined results scored out of 20.
Best UK towns and cities for salary growth


Southend-on-Sea Plymouth Preston
#2 for salary growth #3 for salary growth #4 for salary growth
.jpg?width=726&height=481&name=iStock-948454524-Sevenoaks%20(2).jpg)
Which UK towns and cities saw the biggest pay rises?
The towns and cities with the highest growth in earnings for full-time employees in the last year are:
- Sevenoaks (18.2% increase to £41,239)
- Southend-on-Sea (17.3% increase to £39,260)
- Plymouth (16% increase to £31,615)
- Blackburn (14.8% increase to £31,527)
- Preston (14.8% increase to £33,188)
- Winchester (14.8% increase to £40,600)
Other places that saw inflation-busting pay rises (of 10% or more) include Ipswich, Warwick, Rochdale, Bolton, and Manchester.
The towns and cities with the lowest growth in earnings for full-time employees in the last year are:
- Guildford (-6.1% decrease to £40,142)
- Cheltenham (-5.5% decrease to £35,973)
- Maidstone (-4.1% decrease to £33,369)
- York (-2.1% decrease to £32,251)
- St. Helens (-1.6% decrease to £32,386)
Guildford’s full-time average wage may have fallen since 2022 but at £40,142 per year, it is still 15% higher than the UK’s average (of £34,963).
Towns and cities with the best-paying full-time jobs
 St Albans is among one of the least affordable cities to live in the UK but it does have the highest average salary for full-time workers of £47,641 (36% above the national average of £34,963).
The next highest-paying city is London, with an average salary of £41,853, followed by Warwick and Sevenoaks.
- St Albans: £47,641 (36% above UK average)
- London: £41,853 (20% above UK average)
- Warwick: £41,242 (18% above UK average)
- Sevenoaks: £41,239 (18% above UK average)
- Cambridge: £40,914 (17% above UK average)

.jpg?width=1200&length=1200&name=iStock-481885488-Bath%20(2).jpg)


The best cities in UK for employment opportunities are:
- Winchester (85 out of 100)
- Chelmsford (83)
- Warrington (82)
- Guildford (81)
- Exeter (81)
- Gloucester (79)
- Cheltenham (78)
- Bath (77)
- Chester (75)
- York (72)
- St Albans (72)
- Edinburgh (72)
- Reading (72)
In the year to December 2023, Newcastle-under-Lyme in Staffordshire recorded one of the highest employment rates in the UK at 89.6%. This was a 23.9% increase on the previous year.
Reading, Ipswich, Stratford-upon-Avon, and St Albans also have employment rates of 85% or more.
Where is unemployment lowest in the UK?
Northern Ireland (which includes the figures for Belfast) has one of the lowest reported unemployment rates in the UK, at 2.2%. Of the towns and cities in Ciphr’s study, Cheltenham, Guildford, York, and Bath have the next lowest unemployment rate, of 2.5%. In the year to December 2023, the UK’s unemployment rate was 3.7%.
Which towns and cities have the most job vacancies listed?
Based on figures from three different job sites (Indeed, Glassdoor, and LinkedIn) the city with the highest number of job vacancies listed per person is Cambridge. As at July 2024, 1,151 jobs are being advertised in Cambridge per 10,000 working age adults.
Job hunters in Manchester, Bristol, Oxford and Exeter are also well-served, with an average of 777 listings per 10,000 local workers (the UK average is around 243).
Which UK towns and cities have seen the biggest increase in businesses?
Solihull, in the West Midlands, saw the biggest, double-digit (11.9%) growth in the number of businesses (with 10 employees or more) in 2023.
Other towns and cities that have increased their business population since 2022 include Canterbury (by 9%), Telford (8.6%), and Stafford (7.7%)
Which towns and cities have the most businesses?
After London (51,455), Birmingham and Leeds have the most small, medium and large businesses (with 4,075 and 3,745 respectively).
When adjusted for working age population, it’s Winchester that has the highest density of employers at 179.1. This means that there are over 179 businesses, with over 10 employees, for every 10,000 working age residents (the UK average is 70.2 per 10,000).

Business density is highest in the following UK towns and cities:
- Winchester (179.1 businesses with 10+ employees per 10,000 working age adults)
- Stratford-upon-Avon (107.3)
- Chichester (98.5)
- Sevenoaks (90.6)
- Warwick (89.0)
- Guildford (87.2)
- Horsham (85.6)
- London (84.3)
- St Albans (84.0)
- Belfast (82.1)


UK towns and cities that have the highest rent-to-salary ratio:
- London (47% of the average salary is spent on rent)
- Brighton and Hove (45%)
- Oxford (45%)
- Bristol (44%)
- Edinburgh (42%)
UK towns and cities with the highest average property prices* (comparative to the average salary):
- Guildford: £840,608 (20.9x average salary)
- Sevenoaks: £740,031 (17.9x average salary)
- London: £689,410 (16.5x average salary)
- Winchester: £665,891 (16.4x average salary)
- Bath: £594,503 (15.6x average salary)
Best UK cities for life satisfaction and happiness


Maidstone Lancaster Oxford
#3 for happiness and life satisfaction #4 for happiness and life satisfaction #3 for life satisfaction
The people of St Albans and Maidstone feel the most satisfied about their lives overall, while those living in Sevenoaks, Chelmsford and Preston are among the happiest.

The UK towns and cities where residents reported the highest life satisfaction scores are:
- St Albans: 7.97 out of 10
- Maidstone: 7.92 out of 10
- Oxford: 7.8 out of 10
- Colchester: 7.78 out of 10
- Sevenoaks: 7.73 out of 10
- Winchester: 7.72 out of 10
- Edinburgh: 7.69 out of 10
- Stratford-on-Avon: 7.68 out of 10
- Lancaster: 7.63 out of 10
- Ipswich: 7.62 out of 10
The happiest towns and cities to live in the UK’ – top 10 places with the highest happiness scores:
- Sevenoaks: 7.89 out of 10
- Chelmsford: 7.79 out of 10
- Preston: 7.79 out of 10
- Lancaster: 7.78 out of 10
- Havant: 7.77 out of 10
- Cheltenham: 7.73 out of 10
- Bridgend: 7.72 out of 10
- Plymouth: 7.71 out of 10
- Bracknell: 7.67 out of 10
- Luton: 7.64 out of 10
Best UK cities for job opportunities – #16-33
| Rank | City | Working age population | Salary | vs UK average salary
|
Salary growth | Unemployment rate |
Employment rate
|
Employment rate growth | Business density | Business growth | Property price / salary multiple | Monthly rent / % of salary | Life satisfaction + happiness |
| 16 | Chester | 221,479 | £35,240 | 6277 | 4.1% | 2.1% | 76.5% | 5.5% | 12.9 | 4.2% | £306,499 /8.7 | £775/75% | 14.73 |
| 17 | Telford | 117,708 | £33,222 | £1,631 | 8.6% | 3.4% | 74.6% | -0.1% | 64.6 | 8.6% | £231,538 /6.9 | £660/23% | 15.01 |
| 18 | Horsham | 87,649 | £37,313 | £2,350 | 5.2% | 2.6% | 78% | -13.4% | 85.6 | 42% | £431,698 / 11.6 | £1,175/38% | 14.99 |
| 19 | Edinburgh | 357,141 | £36,539 | +£1,576 | 4.8% | 3.5% | 82.1% | 3.1% | 71.7 | 47% | £335,598/9.2 | £1,268/42% | 14.94 |
| 20 | Oxford | 118,640 | £37,617 | +£2,654 | 2.3% | 3.4% | 80.8% | 0.0% | 67.9 | 2.5% | £575,153 /15.3 | £1,400/45% | 15.36 |
| 21 | Warwick | 96,670 | £41,242 | +£6,279 | 12.6% | 3.7% | 75.5% | -8.4% | 89.0 | 5.5% | £373,979 /9.1 | £945/27% | 14.69 |
| 22 | Swindon | 150748 | £35,327 | +£364 | 5.2% | 2.6% | 80.3% | 7.1% | 49.8 | 0.7% | £281,806 /8 | £825/28% | 14.86 |
| 23 | Bath | 125446 | £38,192 | +£3,229 | 5.1% | 2.5% | 78% | 4.7% | 79.3 | 1.5% | £594,503 / 15.6 | £1,100/35% | 14.58 |
| 24 | Bracknell | 82,366 | £38,565 | +£3,602 | -0.9% | 3% | 80.3% | 2.9% | 57.1 | 11% | £411,380/10.7 | £1,100/ 34% | 15.22 |
| 25 | Ipswitch | 87,931 | £33,346 | £1,617 | 13% | 3.1% | 85.9% | 22% | 64.8 | 0% | £277,507 /8.3 | £772/28% | 14.83 |
| 26 | Northampton | 271,149 | £34,118 | -£845 | 1.7% | 2.9% | 77.9% | -4.6% | 71.2 | 21% | £279,243 /8.2 | £795/28% | 15.03 |
| 27 | Stockport | 180,263 | £37,300 | +£2,427 | 8.1% | 32% | 75.2% | 4.4% | 74.1 | 0.7% | £292,353/7.8 | £825/26% | 14.8 |
| 28 | Newcastle-Under-Lyme | 77,991 | £32,636 | £2,327 | 8.7% | 31% | 89.6% | 23.9% | 55.1 | 1.1% | £183,090/5.6 | £600/22% | 14.82 |
| 29 | Basingstoke | 119,059 | £39,564 | +£4,601 | 2% | 31% | 81.7% | 1.2% | 62.2 | 1.4% | £355,396/9 | £998 /30% | 14.58 |
| 30 | Exeter | 93,255 | £32,827 | £2,136 | 3.4% | 3% | 78.8% | 11.9% | 70.8 | 31% | £340,477/10.4 | £900/33% | 147 |
| 31 | Colchester | 122,378 | £36,125 | +£1,162 | 3% | 3.9% | 75.5% | 12% | 68.6 | 31% | £327,748 /9.1 | £900/30% | 15.34 |
| 32 | Chichester | 72,051 | £35,508 | +£635 | 7.9% | 31% | 65.5% | 3.8% | 98.5 | 3.6% | £447,797 /12.6 | £1,100/37% | 14.77 |
| 33
|
Gloucester | 85,255 | £31,475 | £3488 | 4% | 2.6% | 84.6% | 8.8% | 65.1 | 0.9% | £269,947 /8.6 | £795/30% | 14.82 |
Key:
-
- Rank = overall weighted rank
- Working age population = People aged 16 to 64 years old
- Salary = where mentioned, salary always refers to the median average annual earnings for full-time employees (2023)
- vs UK salary = difference between the city’s average salary and the UK’s median average salary for full-time employees (£34,963)
- Salary growth (2023 vs 2022) = change in salary over the last 12 months
- Unemployment rate = for people aged 16 and older (Jan 2023-Dec 2023)
- Employment rate = for people aged 16 and older (Jan 2023-Dec 2023)
- Employment rate growth = change in employment rate between Jan 2022-Dec 2022 and Jan 2023-Dec 2023
- Business density = number of VAT and/or PAYE based enterprises (with over 10 employees) per 10,000 working age population (2023)
- Business growth = change in the number of VAT and/or PAYE based enterprises (with over 10 employees) between 2022 and 2023
- Property price = average median sold price for all property types (in the last year)
- Salary multiple = multiples of salary required to buy the average property
- Monthly rent = median average monthly rental price (2023)
- % of salary = proportion of salary spent on rent
- Life satisfaction + happiness = measurement of how satisfied people feel about their life overall and levels of personal happiness (Apr 2022-Mar 2023). Combined results scored out of 20.
Top 50 towns and cities for job opportunities: weighted results


